Turn fragmented disease biology evidence into transparent decisions
The knowing01 platform
Bring the public and internal evidence relevant to a program decision into one fully connected workspace.
You and your team can search, compare and interpret the evidence through repeatable workflows, with every result traceable to its original source.
Build the evidence foundation Data Center
Build and manage a tailored data foundation containing the studies, datasets and hooks relevant to your decision.
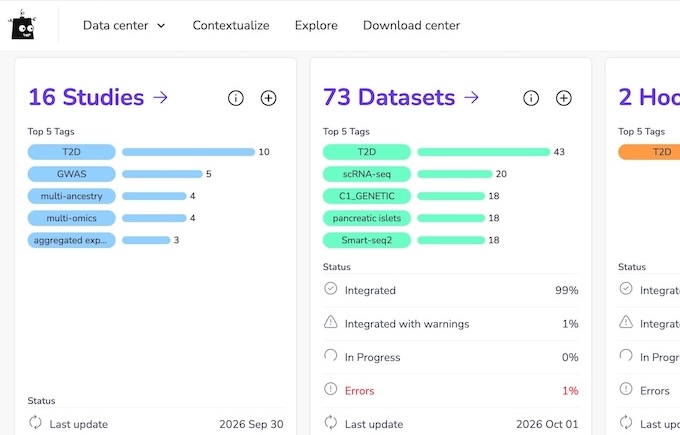
Dashboard
A structured overview of your studies, datasets and hooks, with key metrics, integration status and tag-based breakdowns. Stay in control of integration status, errors and latest changes.
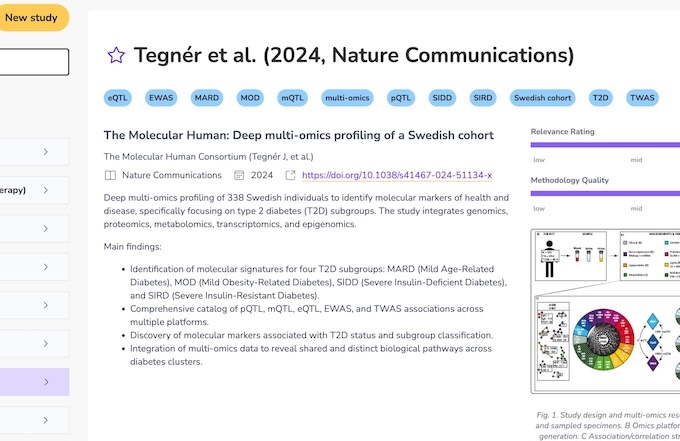
Study view
Each study groups datasets under a shared scientific context, with metadata, a link to the original publication, study numbers and figures. Rate relevance and methodological quality so the platform can prioritize what matters during analysis.
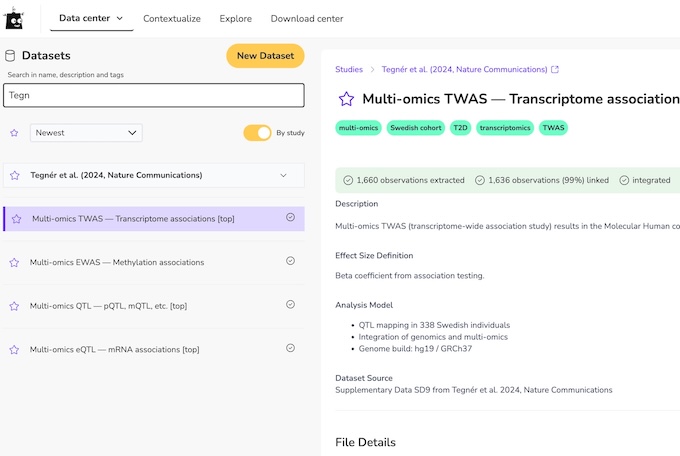
Dataset details
Each dataset retains its source and definitions and is linked to Cellmap with its biotype and relevant statistical parameters. Set cutoffs to control exactly which observations enter an analysis and see how many observations meet each threshold.
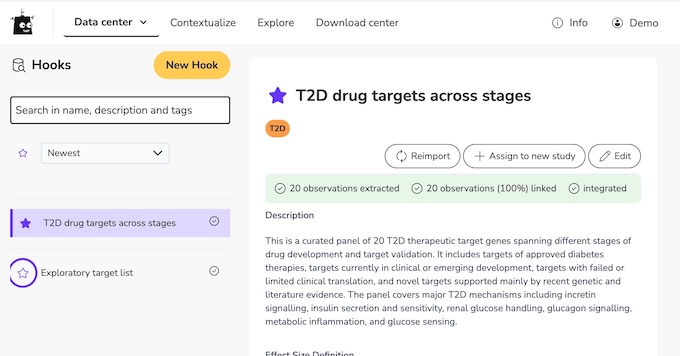
Critical and private lists: Hook view
Hooks are your own lists and saved results: target lists, candidates or findings from Contextualize and Explore. They are kept as first class objects in your protected space and stay reusable across analyses, without leaking into shared or public data.
Data Center in practice
300+ datasets collected, prepared and
harmonised in about 1 weekMulti-species homology relationships
linked automatically500 → 5,000 patients represented after
adding public datasets
See how our partners use modular data foundations in practice.
Integrate data from variants to metabolites Cellmap: harmonise data automatically
Every update of the data center uses our proprietary Cellmap technology to link and normalize data. It links entities across datasets, data types and organisms while preserving their connection to the original source.
Cellmap Knowledge Graph: Data from next-generation sequencing (NGS), mass spectrometry (MS), microarray chip technologies, etc. covering the areas of genetics, epigenetics, transcriptomics, proteomics, phosphoproteomics to metabolomics and their combinations across various organisms (human, mouse, rat and more) are automatically linked by resolving identifiers, ontologies synonyms and related terms.
A single search can therefore retrieve related graph components of evidence even when datasets use different identifiers or biological representations.
Cellmap links evidence from sources such as:
Done for you
- Header and delimiter detection
- Identifier, ontology and synonym resolution
- Linking to the Cellmap
- Summary of linked and unlinked observations
Retrieving observations relevant to a question Contextualize: retrieve connected evidence
Start with a gene, protein, genomic position, dataset or hook. Contextualize retrieves the linked observations from your Data Foundation and brings them into one comparative view.
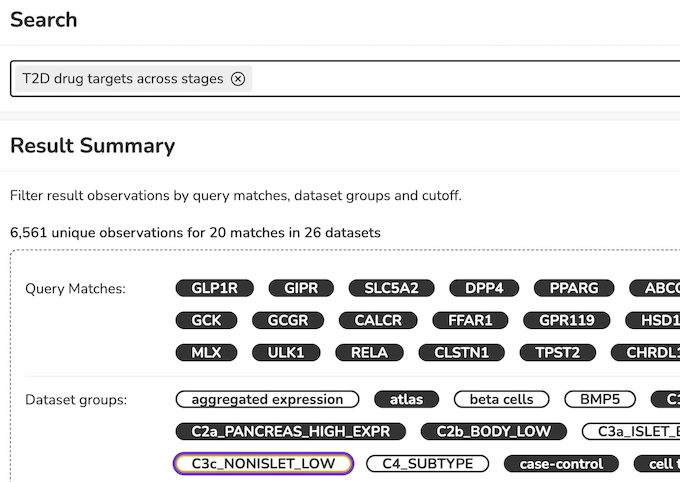
Search
Search across human, mouse and rat genes, proteins and genomic positions, or start directly from a dataset or hook. Results land in an interactive view you can filter by dataset group and cutoff, then export from the download center.
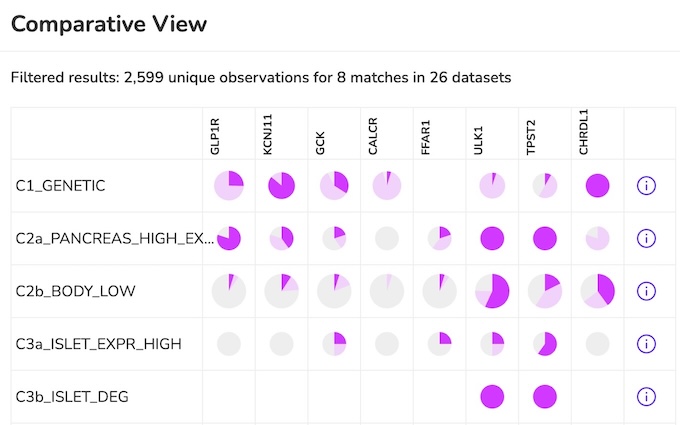
Comparative view
Compare how each query match is represented across your dataset groups. The matrix summarises evidence coverage and links each result to the underlying observations.
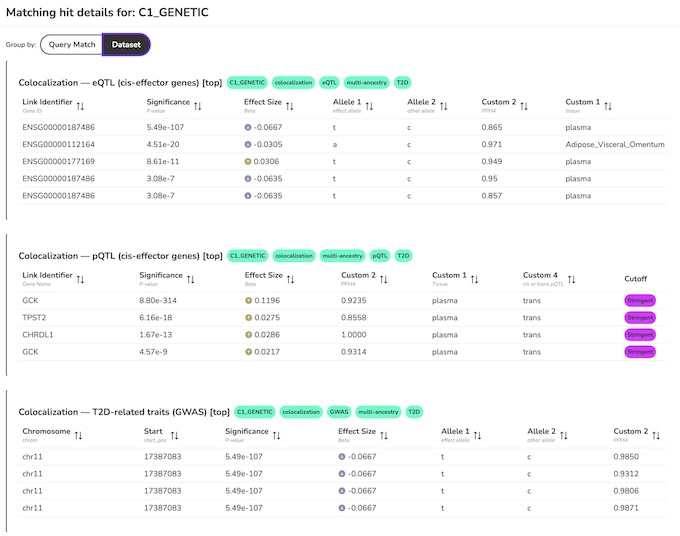
Result deep dives
Open any result to inspect the observations behind the summary, including the dataset, significance, effect size and source metadata. Move from overview to evidence without losing provenance.
Specific data transformation and overlays Explore: understand shared and unique patterns
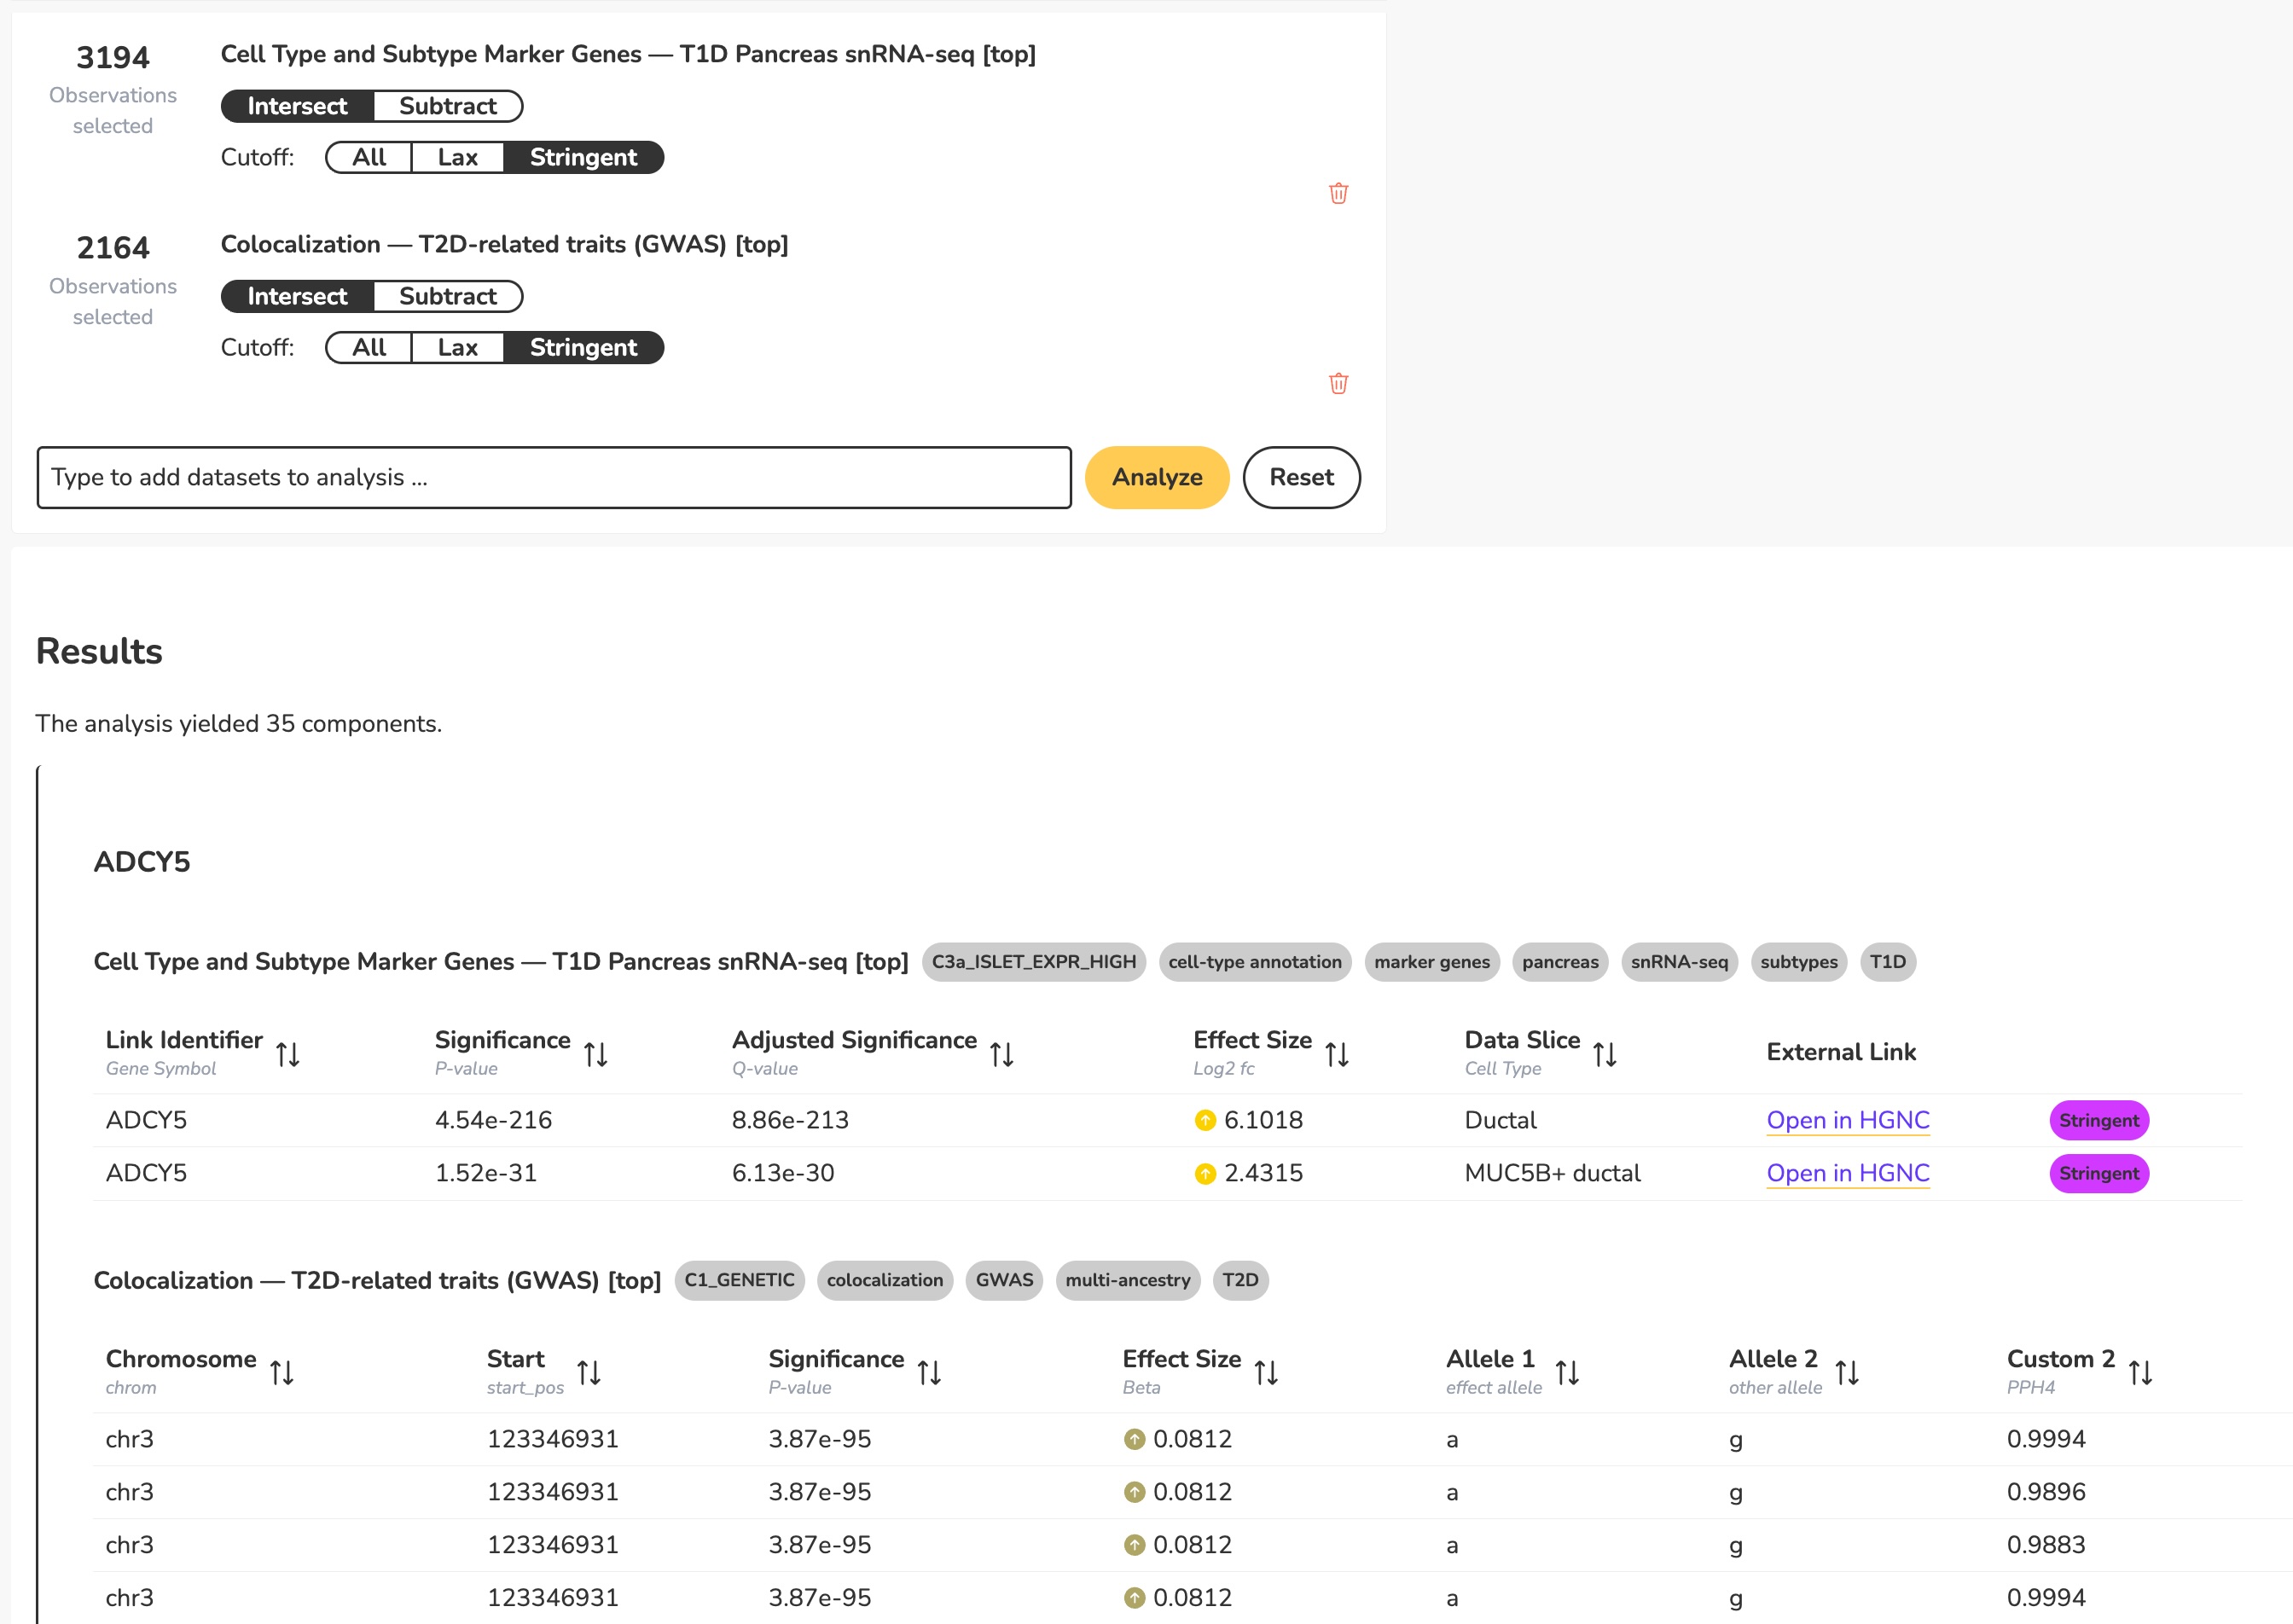
Combine datasets step by step to see what they share and where they differ. Explore computes each intersection or subtraction across the selected datasets.
Explore
Add one dataset, choose whether to intersect or subtract it, then continue with the next. Results are ranked by significance and grouped through relationships such as homology, variant proxies and genomic ranges. Filter by effect direction, review the top results and export the complete analysis.
What our clients ask us
How long does it take to reach a decision using the platform?
A decision workflow typically takes 2 to 4 weeks, including the initial data foundation. The exact timeline depends on the data scope and question. Our Evidence Convergence Protocol provides the four-stage process from scope to documented conclusion.
Do I work on my own or do you run the analysis?
Both are possible. You can work independently with the knowing01 platform, or our Analytics Services team can run the analysis for you. Services can be added to your platform subscription or used as a standalone package. Both options result in a traceable decision package.
What data can I contribute?
Public datasets, your own Multiomics data and your input lists. Everything stays in its original format and your input lists stay separate as hooks, so your intellectual property is never mixed with the evidence base. Learn more about how the modular data foundation is structured.
What type of decisions is the platform designed for?
R&D decisions where the evidence spans multiple datasets: target selection and validation, indication selection and mechanism of action. See our application examples.
How is my data protected?
Our infrastructure runs on a German server provider. The architecture is segmented into distinct zones protected by firewalls and reverse proxies, and redundant storage reduces the risk of data loss.
What does the platform not do?
It does not replace experimental validation, nor does it make decisions for you. The platform links, ranks and tracks the evidence. Your team weighs this evidence and makes the final decision.